Building an Interactive Globe with Open Data
Every pupil had to buy this huge Atlas book (or Schulatlas) that was meant to last for several years in secondary school. When I was a child, I always had to touch a globe whenever I had the chance. These dust collectors used to be valuable.
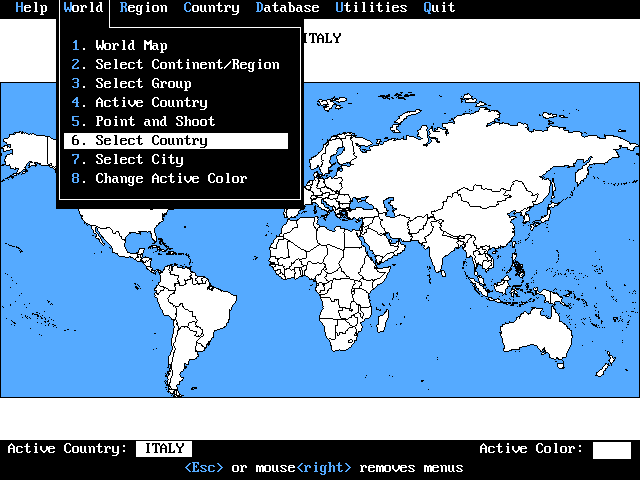
Long before Google Maps, I remember exploring the world with one of our first graphical applications, PC Globe, on our first computer, an IBM AT running at a mighty 8 MHz 8086 CPU. At some point, we upgraded to a 20 MB hard drive, later moved on to Windows 3.1, and along the way, the world atlas on our computer somehow became one of those things that felt almost magical.
PC Globe could show information for around 177 countries, reflecting the political geography of its time. In 2018, Mark Forster sang about 194 Länder and the world has changed quite a bit since those MS DOS days.
So, in this article, we build a digital globe using Natural Earth geographic data to produce vector tiles and MapLibre GL JS to display them. We create an interactive globe using free and open-source tools. No proprietary map service, just open data, modern web technology, and a little bit of that old PC Globe feeling will be recreated.
Tile creation»
I’ve been working with MapLibre GL at work and wanted to display countries on a map. 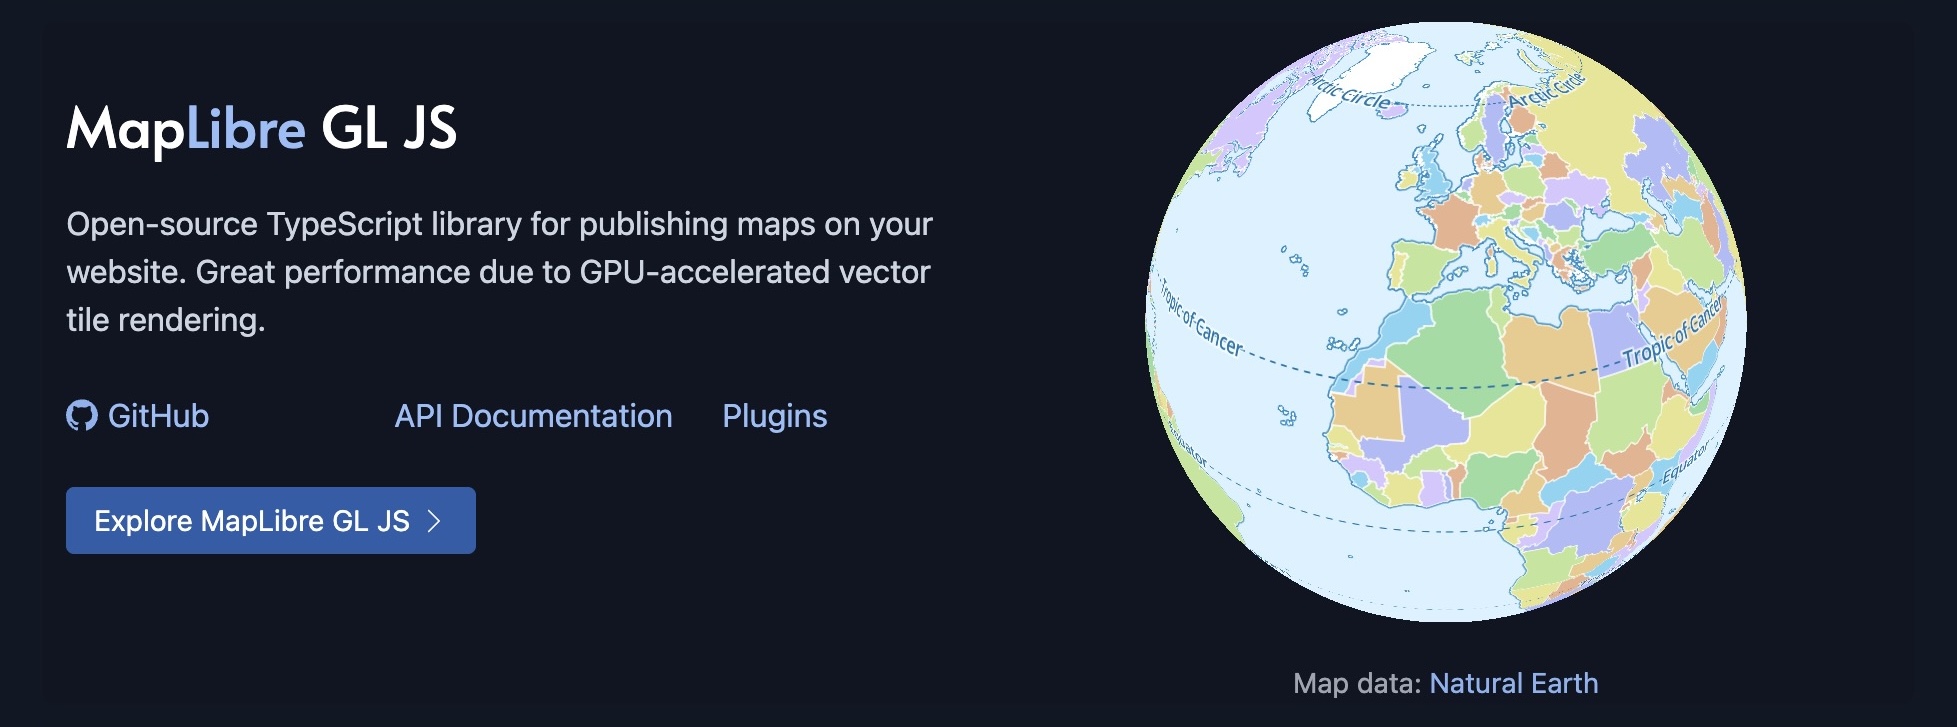 Interestingly, although the library provides Demo Tiles, it no longer documents how the tiles were created, as it did some time ago when it said: “The MapLibre World demo has been kindly provided by the MapTiler team.” The tiles were created with MapTiler Desktop, which is not open source.
OSM Slack and AI rant»
I had started this blog post much earlier, when there was not so much Agentic AI and AI chatbots around. It was much different and more difficult to find out, how to create such a tile set by myself. Besides a Google search and reading Stack Overflow answers, I found my answers in a conversation in the OpenStreetMap Slack community, especially with Daniel Schep (@dschep), Andy Townsend and Andrew Calcutt (@acalcutt).
Today I would only ask an AI chatbot to get that answer or even ready to use code (“software on demand”), but I put out this post anyway, because I think it is important to understand the process and the tools used to create such a tile set. It is not only about the final result, but also about the journey and the learning experience and offers a starting point for others, even for a conversation with an AI chatbot.
Download the data»
The Natural Earth project offers free vector and raster map data at 1:10m, 1:50m, and 1:110m scales. No permission is needed to use Natural Earth. Crediting the authors is unnecessary. However, if you wish to cite the map data, simply put a “Made with Natural Earth” note in your credits. We are going to download the 1:10m scale data.
# or all data: wget https://naciscdn.org/naturalearth/10m/cultural/10m_cultural.zip
wget https://naciscdn.org/naturalearth/10m/cultural/ne_10m_admin_0_countries.zip
unzip ne_10m_admin_0_countries.zip
Conversion to GeoJSON»
From Natural Earth we got shape files with properties embedded. The next step is to convert the shape file to GeoJSON using the ogr2ogr from the GDAL library.
ogr2ogr -progress -f GeoJSON countries.geojson ne_10m_admin_0_countries.shpThe GeoJSON format is a simple way to represent a map data as a text-based format that is easy to read and write based on the JavaScript Object Notation (JSON) standard. Inside the geojson you can see each shape and their country information. So in this step you could easily do automated changes using JavaScript, e.g. NodeJS, to add, remove or enrich that data.
Conversion to MBTiles»
Then we are going to use the tippecanoe tool to convert the GeoJSON to map vector tiles of our data. It is pre-split into tiles for better performance.
tippecanoe -o countries.mbtiles -z6 --drop-densest-as-needed --extend-zooms-if-still-dropping countries.geojsonI found out later, that ogr2ogr can convert directly to mbtiles, so you can skip the GeoJSON step. And I even found more ways, with advantages and disadvantages, but I stick here to my original workflow for now.
The single mbtiles file contains all the tiles of the map as a SQLite database. It is a standard used by many mapping libraries such as MapLibre GL, Leaflet, OpenLayers, and a convenient way to store and share the map tiles. The mbtiles file can be easily uploaded to a server and served by special tile (web) servers.
You can inspect the file using sqlite3, a command-line utility to interact with SQLite databases.
sqlite3 countries.mbtilesThen you can explore the data with sqlite dot commands or sql queries.
.tables
SELECT * FROM metadata;
Convert into tiles/ folder»
The mbtiles file can be extracted to a tile/ folder with the vector tiles using the mbutil. It preprocesses the data, cuts it into tiles, and makes sure it isn’t too much data for a tile going over MapLibre limits so it performs better.
git clone https://github.com/mapbox/mbutil.git
python3 mbutil/mb-util countries.mbtiles tiles --image_format=pbf
The pbf tile files are gzipped so we need to uncompress these to serve them using a regular web server or GitHub Pages.
for file in tiles/**/*.pbf; do
  [ -f "$file" ] || continue
  echo "Decompressing $file"
  gzip -d -S .pbf "$file"
  mv "${file%.pbf}" "$file"
done
Create the tiles/tiles.json»
The tiles/tiles.json file is a JSON file that describes the structure of the tiles in the folder. It is used by the map library to know where to find the tiles and how to access them. We are going to create a tiles.json file with the help of a little and very simple python script.
It accepts some command line arguments about where to find the tiles, the metadata.json and the source mbtiles file. Then it combines the metadata with some general information like format (pbf) and tiles path. Eventually it adds information about the vector layers (e.g. which additional properties every feature has, like country names or abbreviations), grabbed directly from the mbtiles before it writes the tiles.json file.
python3 create-tiles-json.py --tiles-folder tiles --metadata-file metadata.json --mbtiles-file countries.mbtiles --output-file tiles/tiles.jsonCreate a style.json»
The style.json file is a JSON file that describes the style of the map. It is used by the map display library (MapLibre GL) to know how to render the tiles. We are going to write a style.json file manually. It starts also with the usual metadata like name, version, description plus center, bounds, zoom levels and projection to use.
Then it defines the sources, where to find the vector tiles, and the layers, how to render the tiles. The layers are defined in a specific order, so the last layer is rendered on top of the previous layers. The layers can be of different types, like fill, line, symbol, circle, fill-extrusion, etc. Take a look at the documentation by MapLibre GL for more information.
There are also open source tools to build or edit style.json, like Maputnik. It is a visual editor for the JSON style file. It has an inspector to see the properties of the layers and a map to see the changes in real-time. It is a good tool to start with, but you can also use the MapLibre GL documentation to write the style.json file.
Hosting as GitHub Pages»
I created a branch gh-pages and pushed the tiles/ folder as well as a little demo website (html/js/css) to the repository. Everything else is done by GitHub, which serves the files from this Repository as a static website at https://matths.github.io/natural-earth-tiles/ and one can access the tiles/, tiles/tiles.json and style.json.
Display the map»
The last step is to display the map on a website. We are going to use the MapLibre GL library to render the map tiles. The library is a fork of the Mapbox GL library, which is a powerful library to display interactive maps with WebGL. The library is open-source and can be used for free. It is a good alternative to the Google Maps API or the Leaflet library.
The globe above is rendered live from exactly these files. The vector tiles and the label fonts come from my github tiles repository, while the style is a local copy kept in this site’s own repository. MapLibre GL initializes the map in a container element, applies the PC Globe variant with its globe projection, and reveals the country name, in English, when you hover a country. The map is interactive and can be zoomed, rotated, and panned, and it can display markers, lines, and polygons on top of the map tiles.
Take a look at the documentation and examples by MapLibre GL for more information. Natural Earth asks for no credit, but since it is easy to give, the globe keeps the “Made with Natural Earth” note in its bottom-right corner.
UPDATE: this blog post and my tiles repository took much longer than expected, so I finished everything just recently. And Agentic AI did so much progress in the meantime. That’s why the Repository is providing now a Makefiles based workflow to create the tiles and everything automatically, so you can easily reproduce the results.